This is a short and pretty graphical post where I will show the evolution of a "twitter data selfie", that takes all the personal data export allowed by Twitter Inc. and shows it in a particular way. This belongs to a series that ask about public political discourse when is mediated by digital technology, particularly social networks, but will be focused, for the time being, in the creation process, with some mention of particular tools. Some "real aplications" will be advancing with each of our data week workshops/hackathons.
UPDATE (Aug 1st 2016)
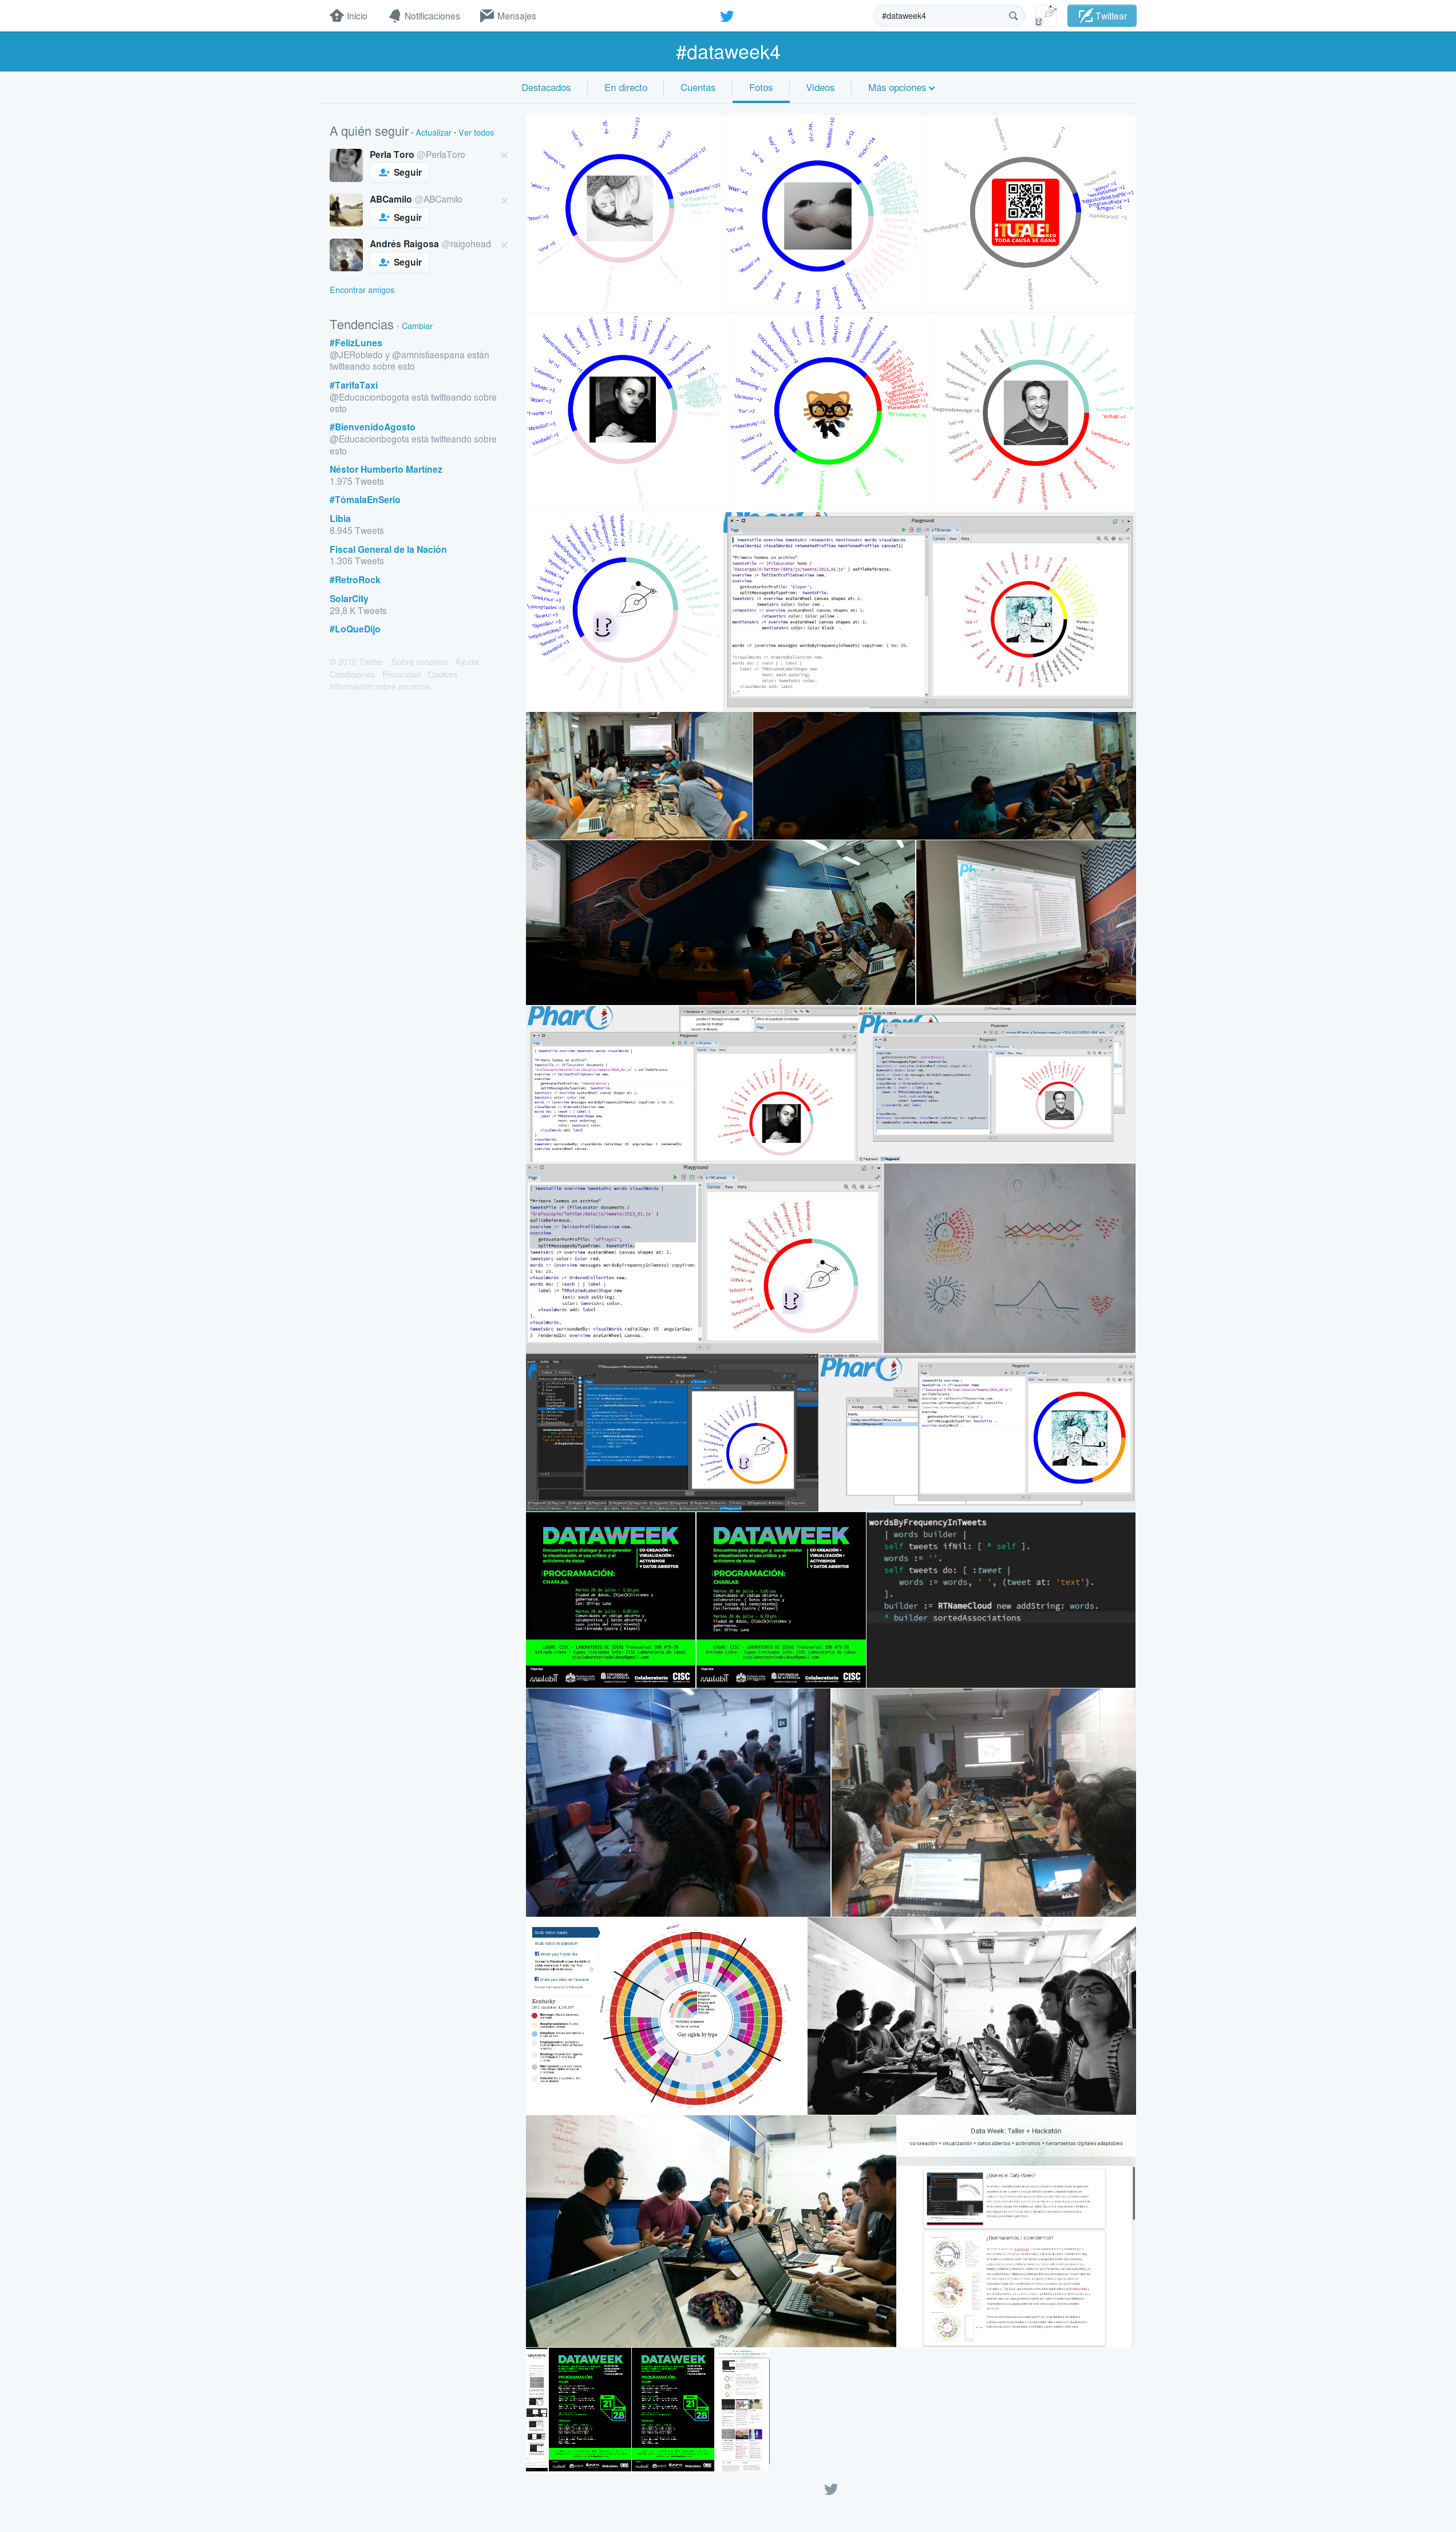
At the end of the blog post you can find our advances and preliminar results from the Data Week 4
and an update on what is comming.
Following with the series about public political discourse when is mediated by digital technology, particularly social networks, I started to device a data visualization that let me see if someone monologues or dialogues in Twitter, which are the frequent words in this discourse and which are the other profiles he/she is retweeting to and replying to. For this I used my own exported dataset, as allowed by Twitter Inc. I will show the process that let me go from paper mockups to a digital working prototype, in broad steps. Code details are better explained in the code itself (wich is available in the Dataviz package). I used the agile visualization platform all along the way.
As usual, I started my visualizations with a hand drawn mockup. For this twitter data selfie, this was the mockup:

The circular figures at the left shown the profile's avatar in the center and is surrounded by colored arcs showing the proportion between 3 kinds of messages emited by this profile: tweets, retweets and replies. Each arc in turn has words (represented by the long dark blue lines) or avatars (in red and yellow). The surrounding words' intensity will change according to the use from dark (most used) to light (less used). The surrounding avatars' size will change according to the amount of retweets and replies this particular profile is getting from the center one. The graphs in the middle show time series for tweets, retweets, and replies over time. The heart at the right represents a tag cloud with words that are more used in the profile's favs. With this convention, the graph above shows a profile that dialogues with many others, replying and retweeting to several of them and have continuous activity over time, while the graph below, shows a profile that moslyt monologue and has a very especific activity over time. (The pencil drawns above and in the lower right corner are just scratches from my friend Aztlek, while presenting him the idea :-) ).
I started to code, what I call the avatar wheel (the circular graph at the left), by extending a prexisting Roassal visualization (as I made before) and putting a scrapped avatar in the middle, getting this (please note that I have not worked on the colors along all the process yet):
![]()
Then I started to play with surrounding circular shapes and arcs with words and extending the Roassal protocols to support this behaviour, as you can see in this screenshot of my working environment:
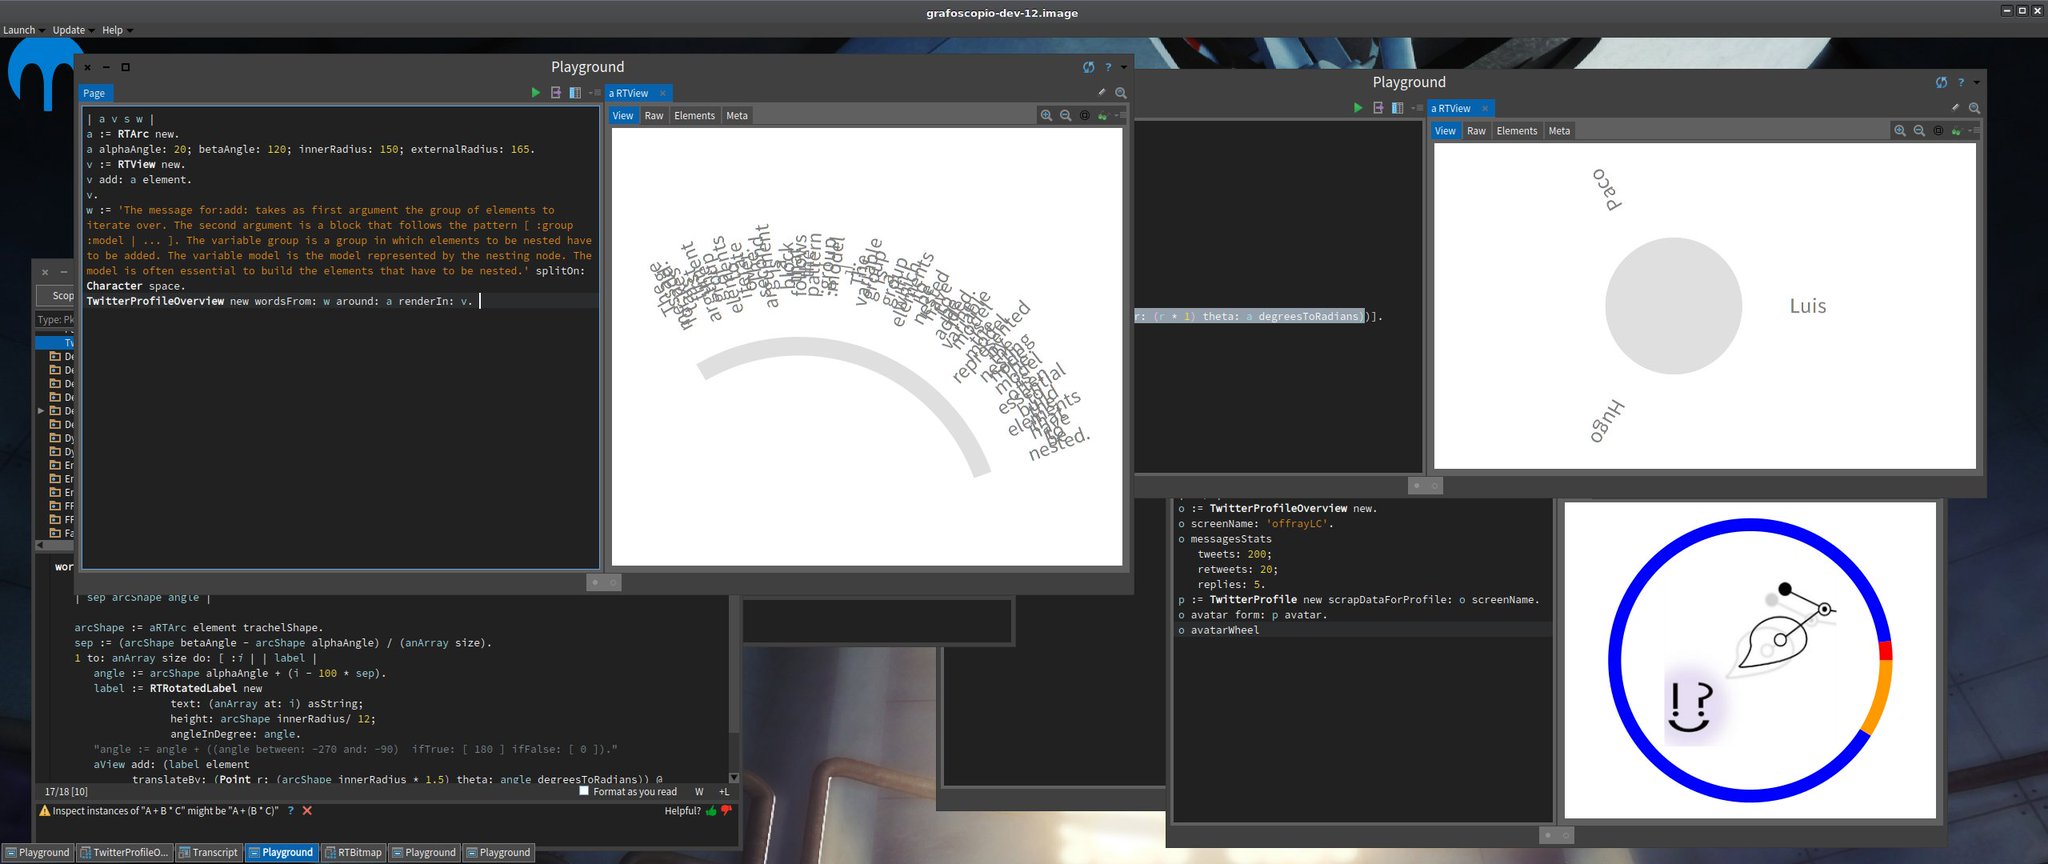
Then I generalized the surrounding arc process to work not only with words, but with any graphical RT object and put it in the proper place (which is TRArcShape, thanks to Milton Mamani's suggestion). Once this was working, it was easy to integrate all the work in a first avatar wheel mockup with dummy data:

Once I had this, it was time to start injecting real data in the visualization. For that I used the excellent Sven's NeoJSON parser to go from JSON files, as exported by Twitter, to the objects that my visualization required, using a custom made scrapper powered by Soup for getting avatars and 3M's (for Mariano, Martín and Max ;-) ) Fuel serializer, as a compact and efficient way to store the enriched data produced by processing Twitter's JSON exported files (and equivalent, in that sense, to my first experiments with SQLite for storing such objects, without the impedance of object-relational mapping).
This are two visualizations that show that avatars and metrics for my from last moth Twitter's interactions, regarding the profiles I have retweeted more:


I have used area of the avatar to represent the amount of interactions (and yes, human cognition and perception studies have shown that we're better with length that with areas), because it can cluster the interactions by relative size, as you can see in the picture above on the left (so 1, 2 or 3 retweeted avatars have almost the same lateral size) and let me have an overview of avatars with different amount of interactions in the same space, while still making small avatars visible, despite the size of bigger ones, and it fits the square area used by Twitter avatars. But getting them rendered around an arc with a nice layout is not possible, using the current algorithm, as shown by the picture below of my last month retwets:
Our 4th version of the Data Week in Medellín, Colombia was a joyful learning experience. Thanks to all the peple involved in making this happen. We focus our problem/project advances on reading and querying the JSON exported from the Twitter's data dump and use them to locate data represented as visual text surrounding the avatar wheel: most used words in tweets, most retweeted profiles and most mentioned profiles in replies. Here you can see a visual gallery, as reported by Twitter and by Tupale of our progress on the event (click on each image to go the the sites).

What comes next: In the technical part, this is what is comming in next events on this problem:
- The avatar wheel prototype will be finished once avatars bitmaps can be
placed into the surrounds of the avatar wheel with a good layout algorithm (I will look at the
RTFlowLayoutalgorithm for inspiration), as well as the words with proper color intensity for frequency. - Next will be the other parts of the paper mockup, and we will use upcoming community events (mainly Data Weeks and Data Rodas) to improve the custom visualization.
- I'll focus in my solo work, mostly in the notebook part of Grafoscopio, mainly to write my PhD thesis and using it as a use case of what is needed.
But the real potence will be when we start the social/community mobilization about twitter data selfies and cross other data sources we have been working on. Stay tunned.